Student Data Visualization Contest
Published
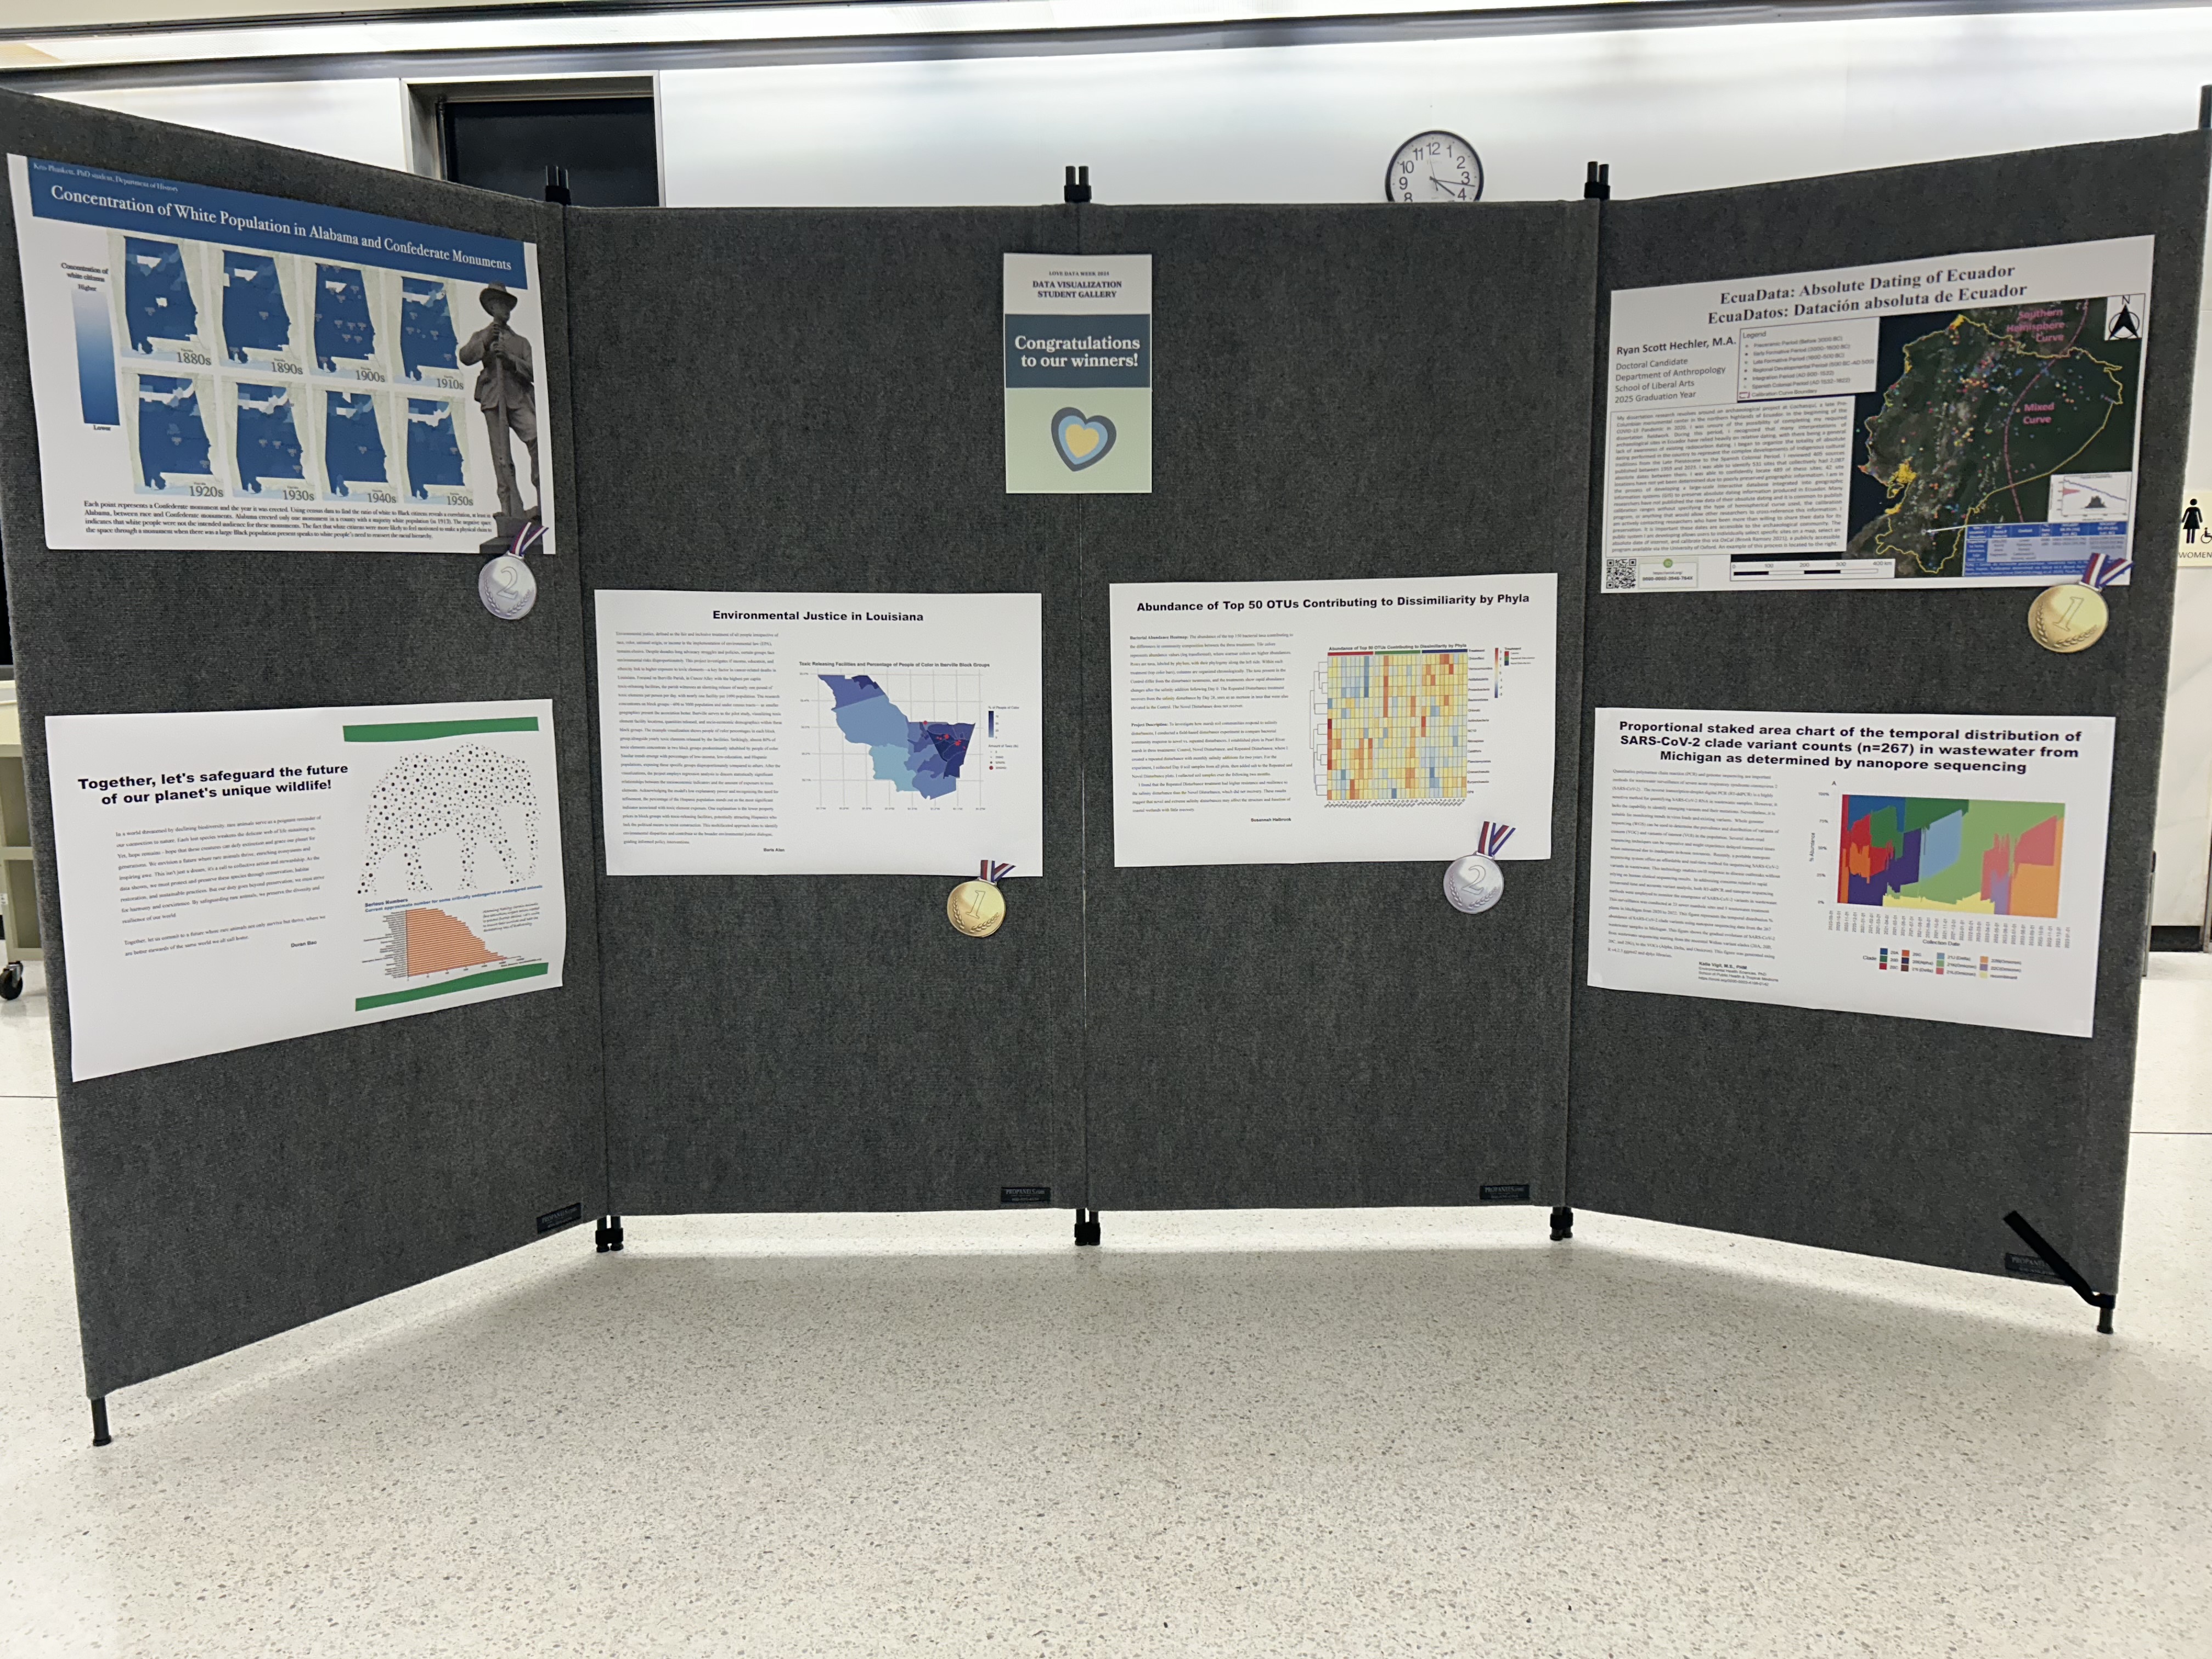
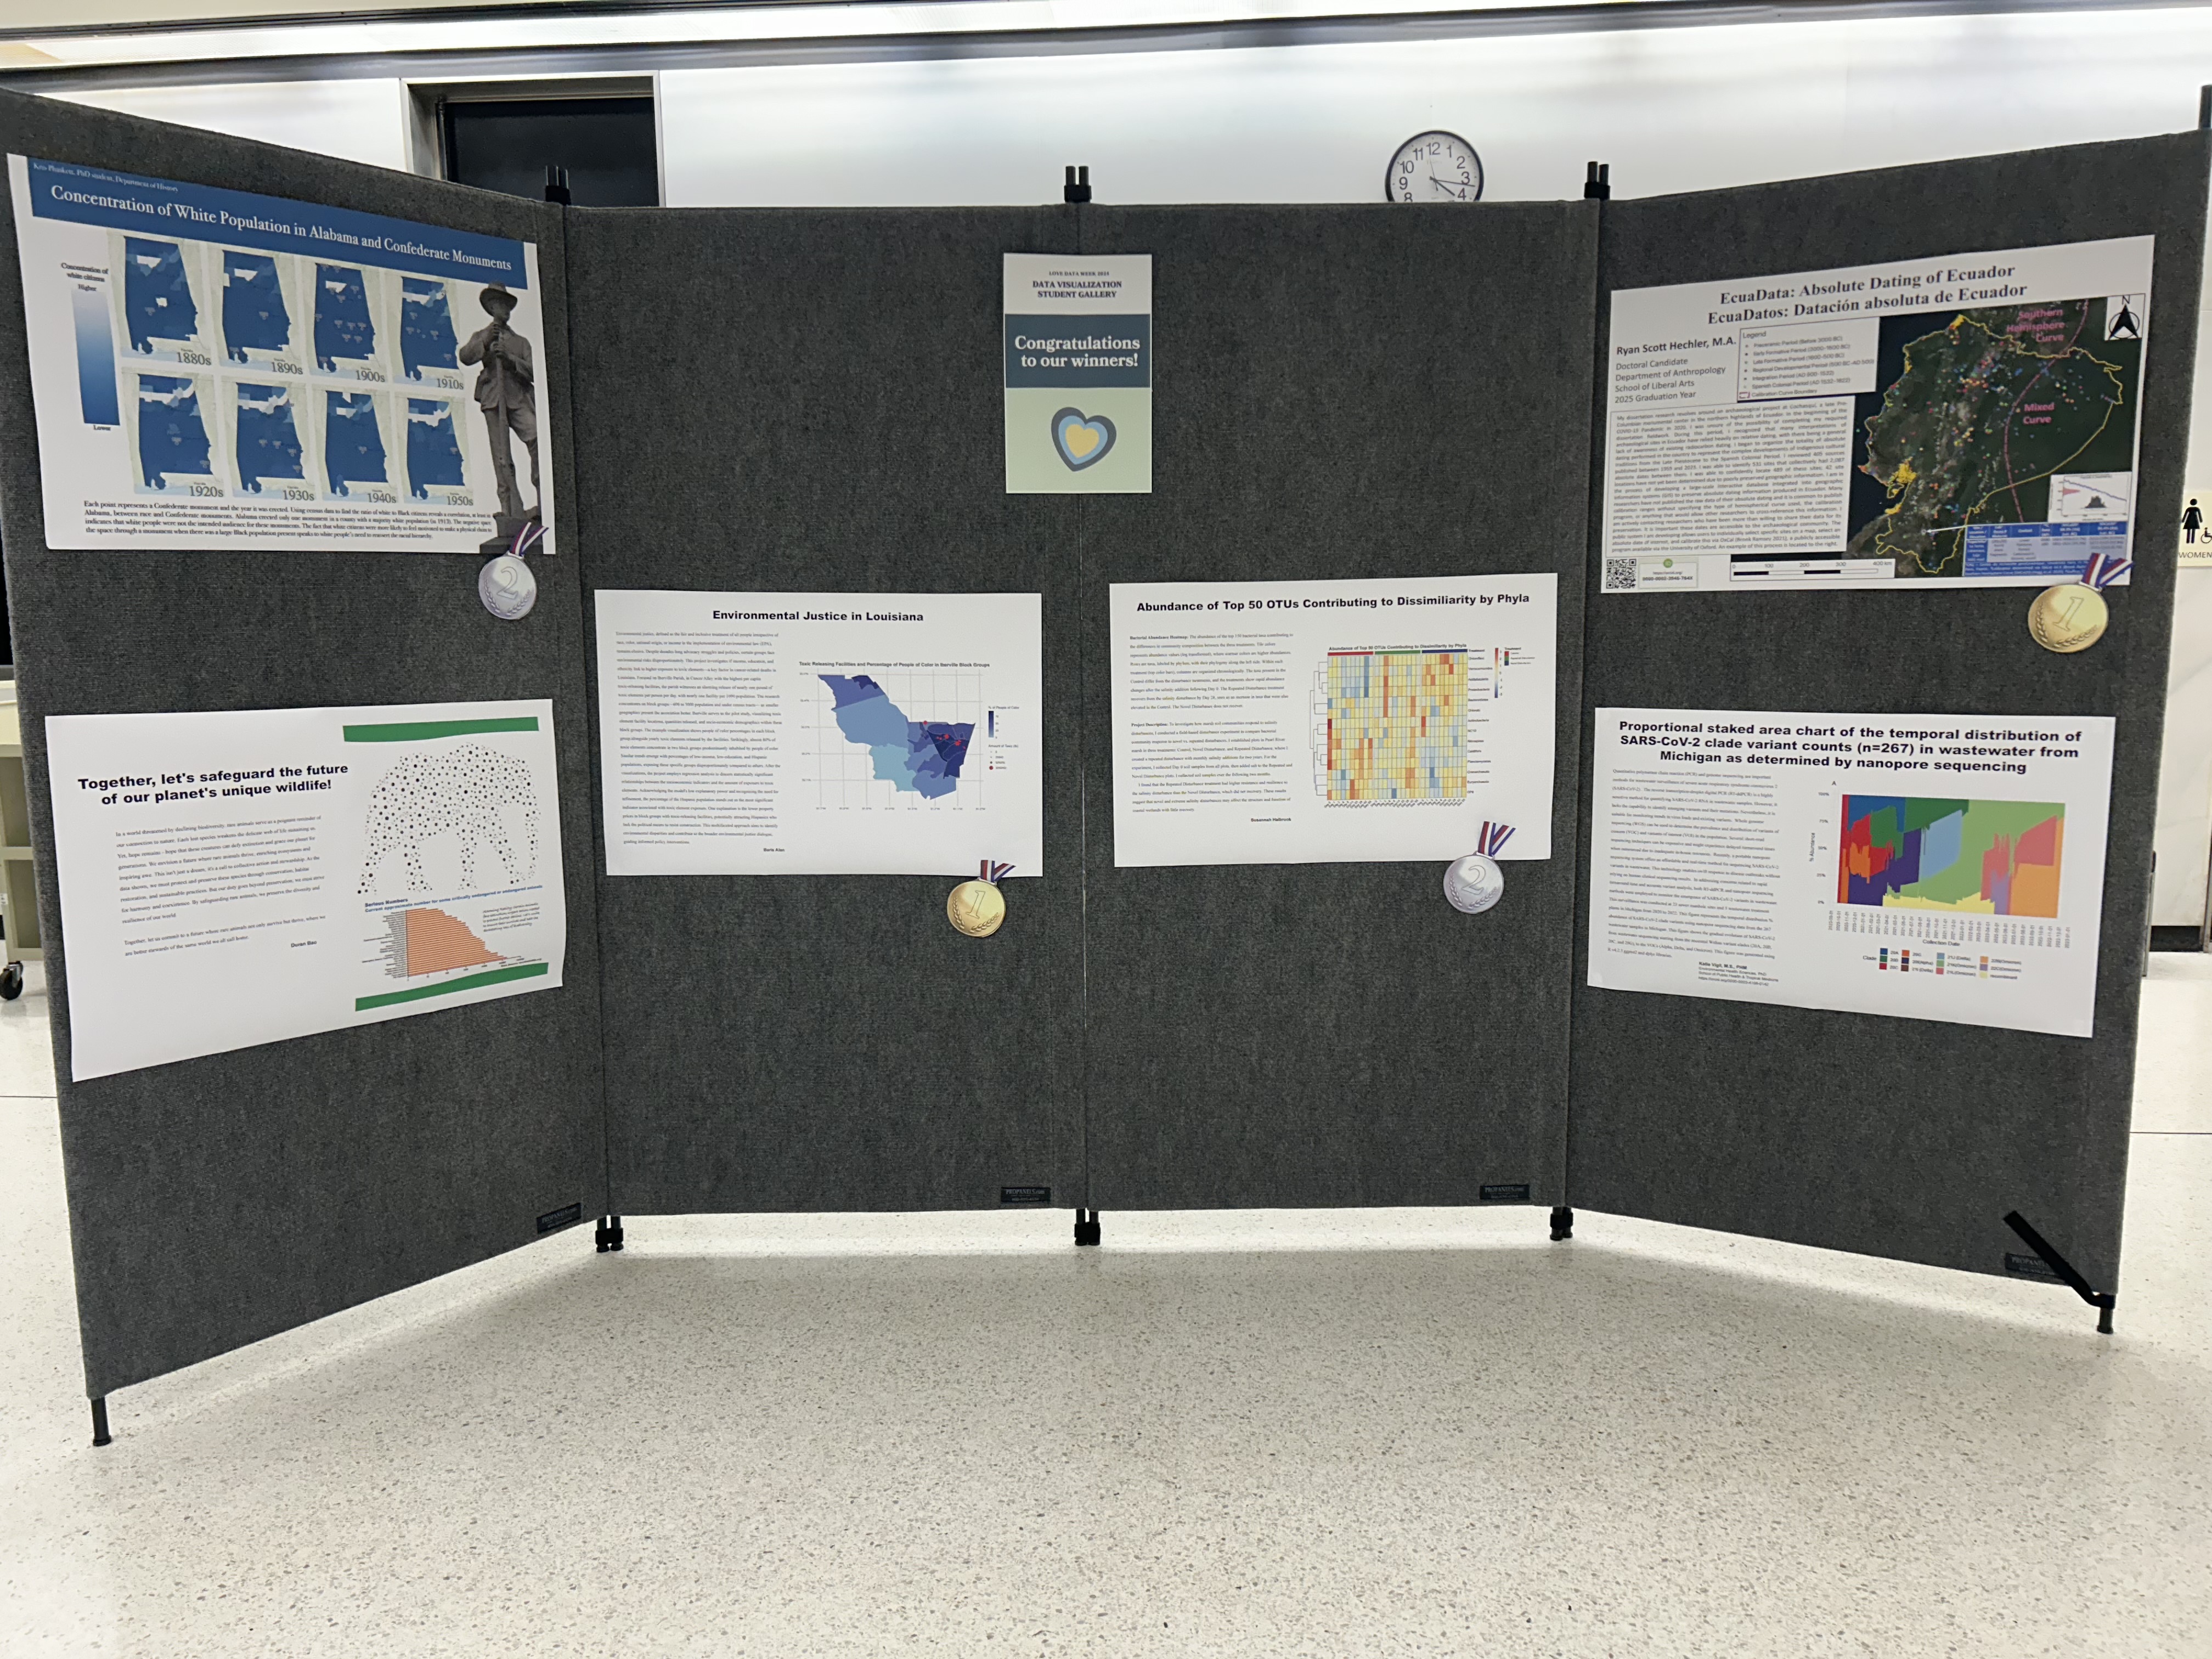
Tulane University Libraries recently held its Student Data Visualization Contest in collaboration with the Connolly Alexander Institute for Data Science (CAIDS), and Ryan Hechler (Anthropology) & Baris Alan (Political Science) emerged victorious! The competition aimed to showcase innovative data visualizations created by students across various disciplines. Let's take a closer look at the inspiring winners and their projects with Scholarly Engagement Librarian Kay P Maye:
KM: What inspired you to submit to the contest?
RH: I personally respect the work of the Connolly Alexander Institute for Data Science and they have generously supported other facets of my research in the past. I like their approach of emphasizing data science at the university level, beyond one specific department. Once I saw the posting for their partnership with Tulane’s Libraries for the Student Data Visualization Gallery for Love Data Week, I thought it would be a great moment to present my personal project of a nation-wide database of absolute dating information for Ecuador. I thought it would be fun to participate in the gallery and I knew the event would attract a thematically diverse range of presentations from different departments. It was wonderful to simply be a part of this.
BA: I was motivated to participate in a school-wide contest to showcase my visualization, aiming to raise awareness among fellow Tulanians about pressing socio-economic and environmental issues.
KM: What inspires your research?
RH: I am obsessively interested in organizing a wide variety of archaeological, ethnohistoric, cultural, linguistic, geographic, and geological data from the Andes and Amazon of South America, this is a region I have been actively studying in since I was a teenager. When I was younger, I quickly recognized the complex and diverse range of Indigenous societies in the Andes and Amazon (past and present) which have inspired me to continuously learn from a multi-disciplinary approach. These interests have been further supported and grown here at Tulane University, particularly by my advisor Dr. Jason Nesbitt who shares a similar interest in exploring absolute dating. Within my region of study in Ecuador, there is a bit of a disjointed understanding between researchers about the sheer wealth of published data due to the rarity of some of the respective journals, edited volumes, and books that contain this information. Part of this can be attributed to informational accessibility. With this in mind, it is important to acknowledge the excellent work of Tulane’s Interlibrary Loan Services. The amazing staff at the Howard-Tilton Library have helped me track down some very hard-to-find publications and I am exceptionally appreciative of their efforts.
BA: My research is fueled by a profound passion for socio-economic and environmental injustices, serving as the primary impetus behind my work. I contend that these issues are not exclusive to developing or underdeveloped nations; even developed countries grapple with them. Consequently, I focused on environmental injustices in Louisiana, considering it one of the most pressing problems facing the state, and wanted to be part of positive social change.
KM: What do you plan to do with the money you won?
RH: I will use the award to further invest in growing this absolute dating database of Ecuador. I started this project in 2020 in a moment where I was genuinely unsure of my ability to physically continue my doctoral research in Ecuador due to the COVID-19 Pandemic. Thus far, I have worked on this project entirely with my own personal time and funds and I hope to secure further institutional support as this project continues to grow. Interestingly, this database has attracted a lot of attention in Ecuador - even though it is still in development - and I am frequently contacted by researchers looking for information about their respective regions of study. While elements of this database will feature into my doctoral dissertation, this has turned into its own independent project that I am deeply passionate about and it will continue past my doctorate here at Tulane.
BA: I am considering allocating the winnings towards a data analysis workshop, enhancing my analytical skills and furthering my research capabilities.
KM: What advice do you have for someone interested in creating data visualizations?
RH: Focus on something that genuinely interests you, something you are willing to spend hundreds, if not thousands, of hours on. Perhaps it is an often neglected problem within your discipline, or perhaps it is a pre-existing research focus that needs to be studied from an entirely new angle. Determine the most efficient way to represent your data visually, not just for colleagues within your discipline but also for those members of the public that may be interested as well. For me personally, I love geographical information systems, database management, and graphics editing - thus it was personally rewarding to pursue a project that combines all three. If and when possible, I would recommend implementing open access, open source, and/or (reputable) free software as accessibility is very important.
BA: Data, along with its visualization, possesses the power to either obscure or illuminate critical facts. As a social scientist, I advocate for data visualizations that inform and unveil societal problems and injustices, urging a commitment to transparency and social awareness.
The winners of Tulane University Libraries' Student Data Visualization Contest have demonstrated not only technical proficiency but also a deep commitment to addressing real-world issues through data-driven insights. Their projects serve as inspiring examples of how data visualization can contribute to academia and society, fostering positive change and raising awareness on pressing socio-economic and environmental challenges.
